Weekly Meter
DC / MD / VA / WV
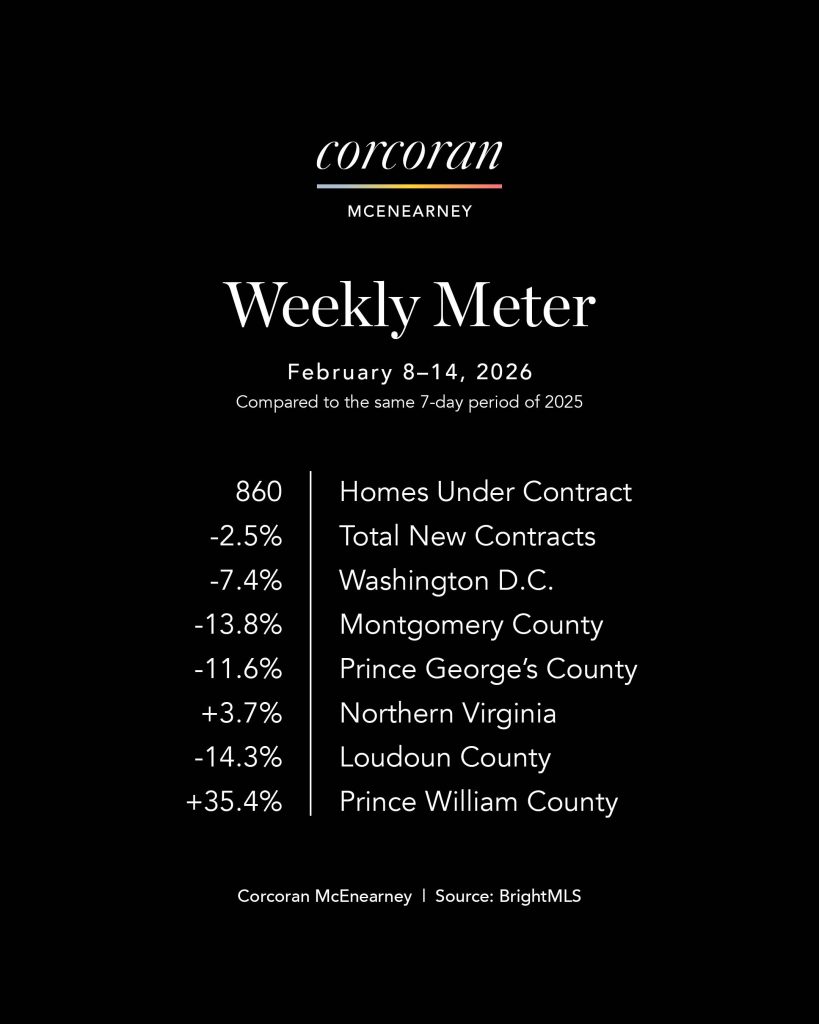
We compare contract activity for the same seven-day period of the previous year in Loudoun County, Prince William County, Northern Virginia, Washington, DC, and Prince George's County. These statistics are updated on a weekly basis. Sign up for our newsletter on the latest market data.

Cold Outside, Steady Inside
Total new contract activity for the week of February 8–14 was down just 2.5% compared to the same week last year—a remarkably modest decline given the continued cold weather and ongoing winter friction in the marketplace
Key Takeaways
- If last week felt slightly less Arctic than the week before, the market responded accordingly. Activity held nearly flat year over year, a clear signal that demand remains present and engaged.
- Across the Metro DC region, buyers continued to transact despite shorter days, colder temperatures, and the natural seasonal drag that February brings.
- Northern Virginia posted gains in weekly contract activity, and Prince William turned in another notably strong performance. Other jurisdictions – in general the most urban areas - showed modest pullbacks.
- The primary shift remains timing. Average days on market for homes going under contract increased by five days, from 39 days last year to 44 days this past week.
- That increase reflects deliberation, not disappearance. Buyers are evaluating options carefully and negotiating with confidence, particularly as inventory levels slowly improve. What stands out most is stability. Even in the heart of winter, contract volume is nearly matching last year’s pace. That speaks to a durable demand base heading toward the spring market.
Why It Matters
- A 2.5% dip in weekly contracts is statistically modest and seasonally explainable. The weather last week was far harsher than the same period last year.
- The more meaningful signal is the gradual increase in days on market. This confirms what we’ve been observing: buyers are active, but they are no longer rushed.
- Longer timelines reward preparation and pricing discipline. Well-positioned homes continue to attract interest. Homes that overshoot on price or presentation face longer absorption periods.
- This is a market finding equilibrium—not losing momentum.
Boots On the Ground — and Contracts on the Rise
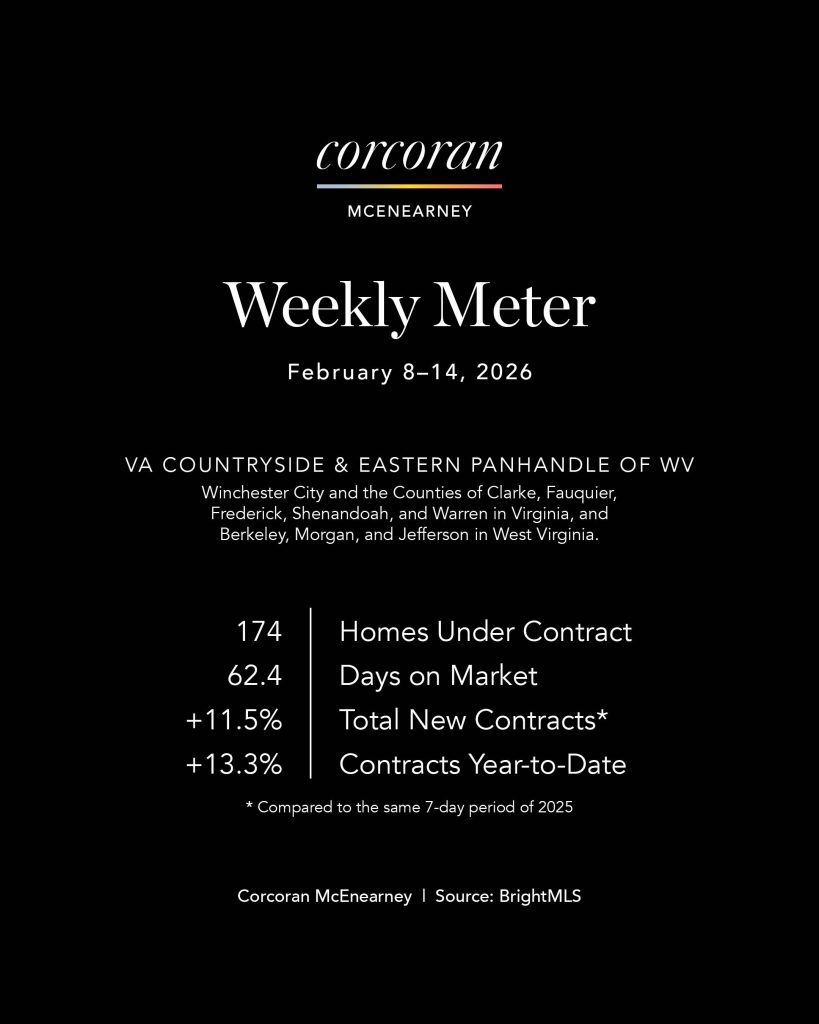
While winter continues to remind us who’s in charge, the Virginia Countryside and West Virginia Panhandle markets clearly decided that cold weather is not a reason to stay home. Total new contract activity across the two areas rose 11.5% compared to the same week last year
Key Takeaways
- That marks another strong performance in what has been a solid start to the year. Even more encouraging, year-to-date contract activity is now up 13.0%, reinforcing that this isn’t a one-week anomaly but part of a broader pattern of steady demand.
- Both areas contributed to the gain. The Virginia Countryside posted a notable increase in weekly contracts, particularly under $750,000, while the West Virginia Panhandle continued to build momentum across several price points. Buyers in these markets remain purposeful and engaged, even when winter conditions make showings less convenient.
- The one area of moderation remains timing. Average days on market for homes going under contract increased from 56 days last year to 62 days this year.
- That modest rise reflects the same broader regional theme: buyers are active, but they are not rushed.
Why It Matters
- In markets like the Countryside and Panhandle, activity is often driven by intentional buyers rather than impulse decisions. An 11.5% increase in weekly contracts—despite winter conditions—signals confidence and commitment.
- The slight increase in days on market reinforces the idea that this is a thoughtful market. Buyers are moving forward, but they are evaluating options carefully. That balance between activity and deliberation is healthy and sustainable.
- With year-to-date activity up 13%, these markets are entering the early spring period with real momentum.
The Real Estate Details
- Virginia Countryside was up 20.3% and is up 16.4% year-to-date.
- West Virginia Panhandle was up 4.6% and is up 10.3% year-to-date.


